


Over the years, Excel has continued to improve, yet many people are stuck with old ways that require manual updates and complex work, often because they’ve grown accustomed to using them. If you find yourself constantly re-filtering data, manually deleting duplicates, or wrestling with complex lookup tables, you’re likely relying on tools that have already been replaced by more efficient, dynamic alternatives.
By moving away from these old methods, you can automate your Excel workflow and reduce common errors that occur when tasks rely heavily on manual input.
When I learned these 3 functions, I stopped wasting time in Excel.
Small formulas, big time savings.
VLOOKUP
Stop fighting column boundaries.

If you’ve been using Excel for a while, you’ve almost certainly used VLOOKUP. For decades, it served as the go-to formula for pulling data from one table to another, and for a long time, it remained impressive. But VLOOKUP comes with several quirks that can easily mess up your spreadsheet.
The first problem is structural: your lookup value must always be in the leftmost column of your selected range. This may seem manageable until you need to find the employee name based on the ID in cell A2 from the table in the range B2:E7. VLOOKUP cannot perform this lookup because the ID (lookup value) is not in the first column of the table.
Then the column index is number. Each time you use VLOOKUP, you have to manually calculate which column position holds the data you want. If you add or remove a column from your table, that number becomes incorrect, your formula breaks, and you debug something that was working perfectly yesterday. On top of that, VLOOKUP defaults to an approximate match unless you remember to add FALSE to the end of your formula.
The modern solution is XLOOKUP. Instead of referencing an entire table or range and counting columns, XLOOKUP allows you to point directly to the column you’re looking up (lookup_array) and the column or columns you want to return (return_array):
=XLOOKUP(lookup_value, lookup_array, return_array, [if_not_found], [match_mode], [search_mode])
This separates the search array from the return array, so the result can appear to the left or right of the search column. If you want to look up an employee’s name and department at the same time, a single XLOOKUP formula can handle both, eliminating the need to write two separate lookups. XLOOKUP is also an exact match, so one of the most common VLOOKUP mistakes is eliminated right from the start.
Remove duplicates.
Why repeat the same cleanse every day when a formula can handle it?
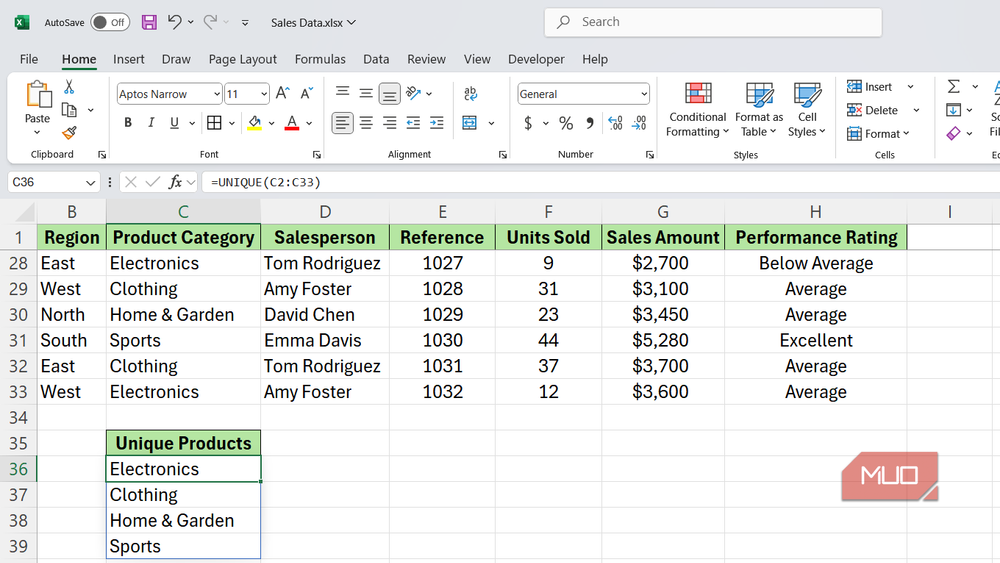
Duplicate entries are a headache in any dataset, whether they’re duplicate customer records or repeated order IDs; Idle entries can kill your total. Excel’s built-in Remove Duplicates button has been a standard fix for years, and when it works, it permanently deletes rows from your spreadsheet.
This means that every time your data changes—when you add new entries or someone pastes in a fresh export—you have to run the whole process all over again. You select your range, go to Data Tab -> Data tools -> Remove duplicates.select your columns, and click okAll over again. And since the tool deletes the data, there’s no easy way to reverse the action if you later realize you’ve removed something you need now.
The UNIQUE function offers a better solution:
=UNIQUE(array, [by_col], [exactly_once])
Instead of deleting anything, UNIQUE reads your source data and generates a live, automatically updated list of distinct values in a separate location. When a new name is added to your original list, the unique output is automatically refreshed. When a duplicate disappears from the source, the list is adjusted to reflect the change. Nothing gets deleted, nothing needs to be replayed, and your cleanlist stays current without any extra effort.
Auto filter
Skip the copy-paste routine.
AutoFilter is an incredibly useful tool for narrowing down your data to a specific subset, whether that means only looking at East region sales or focusing on pending invoices. However, this is less helpful when you need to share that filtered view, put it in a report, or keep it updated as your data grows.
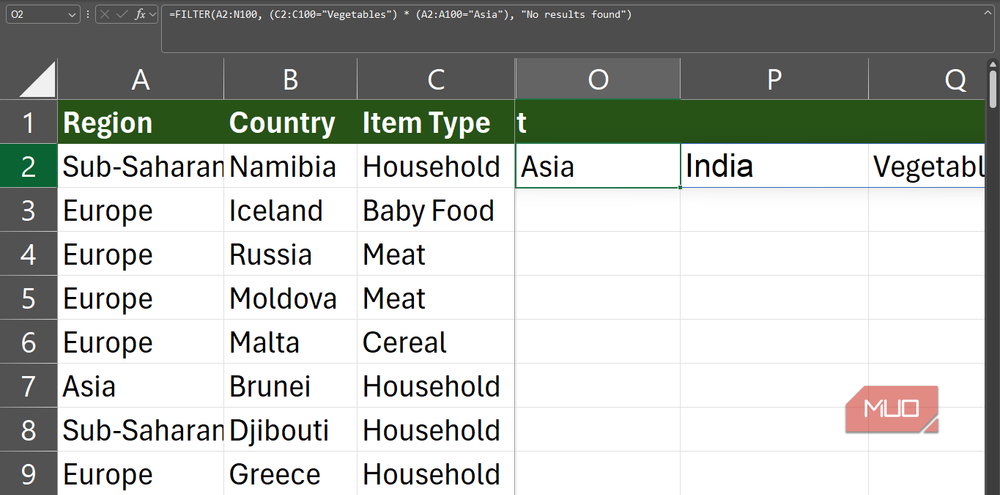
The problem is that the autofilter only hides the rows. It does not actually transfer or extract data. So, if you want a separate, report-ready list of all “office supply” transactions from the Asia region, you filter the data, select visible rows, copy them, switch to another sheet, and paste. Every time your underlying data changes, you have to repeat the entire process from scratch.
The FILTER function handles this automatically, which is why I use this function for everything now. You write a formula, specify data to evaluate and conditions to apply, and it generates a live table that matches your criteria:
=FILTER(array, include, [if_empty])
When a new transaction appears in your source data, it is immediately reflected in the filtered output. You can also easily layer conditions by using AND logic, OR logic, or a combination of the two in a single formula.
For example, to create a live list of all “vegetables” sales in the “Asia” region, you could use the following formula:
=FILTER(A2:N100, (C2:C100="Vegetables") * (A2:A100="Asia"), "No results found")
This formula creates a fresh table that is automatically updated when you add new sales to your main dataset.
How to Use the Filter Function in Excel
Want to streamline your data analysis in Excel? Learn how to effectively use the FILTER function to simplify your data and improve productivity.
Advanced formulas mean fewer mistakes and less maintenance
Moving from manual tools to dynamic array functions like XLOOKUP, UNIQUE, and FILTER lets you create spreadsheets that maintain themselves instead of requiring your input every time something changes. All the time you currently spend re-running filters, re-cleaning lists, and re-fixing broken searches is time you could be directing to meaningful analysis.
Excel has already done the hard work of building better tools. You just need to start using them.
- OS
-
Windows, Mac OS
- Supported desktop browsers
-
All through the web app
- The developer
-
Microsoft
- Free trial
-
A month
- Pricing model
-
Membership
- iOS compatible
-
yes
Microsoft Excel is a powerful spreadsheet application used for data organization, analysis and visualization. It supports formulas, functions, pivot tables, and charts to efficiently process complex datasets. Widely used in business and education, Excel also integrates with other Microsoft 365 apps for collaboration, automation, and real-time data insights.